
 Posted by
 FREQUENCY BAND EXPLORER
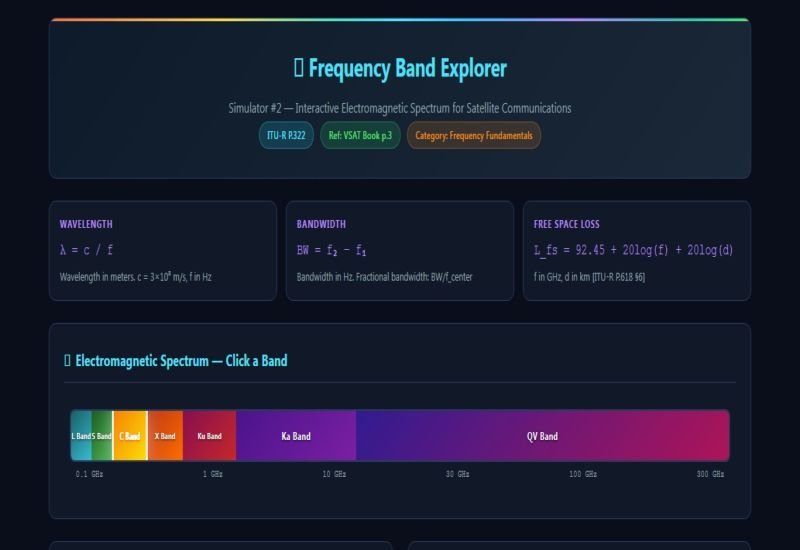
Explore interactive satellite communication spectrums with our Frequency Band Explorer tool. Analyze VSAT frequency bands (L to Q/V), calculate wavelengths and path loss, and visualize ITU-R rain attenuation data in real-time.
📡 Frequency Band Explorer
Simulator #2 — Interactive Electromagnetic Spectrum for Satellite Communications
🌈 Electromagnetic Spectrum — Click a Band
🔍 Band Properties
👆 Click a band on the spectrum above to explore its properties
📊 Band Comparison Matrix
| Band | Freq (GHz) | λ (cm) | Attn. (dB/km) | VSAT Use |
|---|
📏 Wavelength Scale Visualization
📉 Atmospheric Attenuation vs. Frequency
Rain attenuation (at various rates) and oxygen attenuation vs. frequency. Key VSAT bands highlighted.
📋 VSAT Application by Band
📚 ITU References & Source Documentation
1. ITU-R Recommendation P.322 — "Propagation data relevant to satellite service design"
Provides the fundamental framework for defining satellite communication frequency bands, their propagation characteristics, and the basis for selecting appropriate bands for VSAT applications.
2. ITU-R Recommendation P.618 — "Propagation effects relevant to satellite service"
Section §6 covers free-space path loss equations and frequency-dependent atmospheric effects. Section §7 addresses rain attenuation data essential for Ku/Ka-band VSAT link budgeting.
3. ITU-R Recommendation P.838 — "Propagation data for frequencies above 6 GHz"
Provides the specific attenuation model A_rain = k × R^a with k and a coefficients for each frequency band used in the attenuation chart.