
 Posted by
 BER Curve Generator
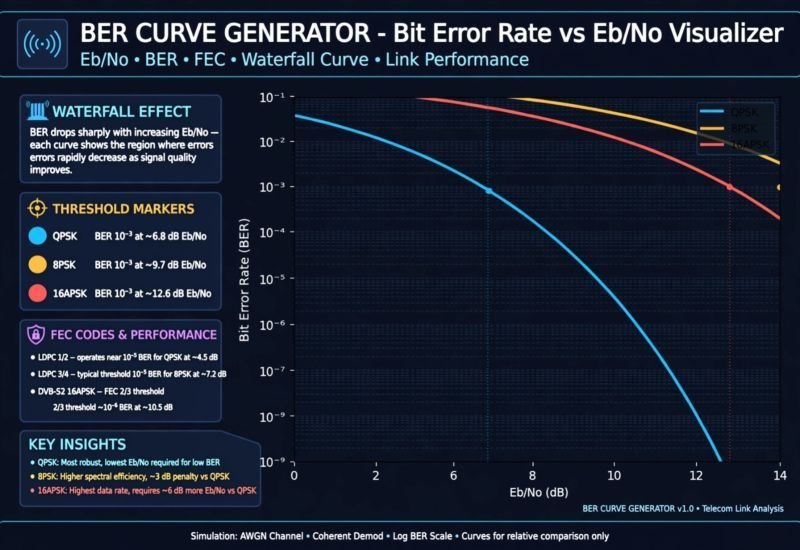
BER Curve Generator helps you visualize bit error rate performance across different Eb/N0 values, compare modulation schemes, and understand digital communication system performance.
📡 BER vs. Eb/N₀ Curve Generator
Interactive BER Analysis for Digital Modulation Schemes — ITU-R Standards Compliant
⚙️ Controls
BPSK
QPSK
8-PSK
16-QAM
Current BER at Selected Eb/N₀
3.55×10⁻⁶
BPSK
3.55×10⁻⁶
QPSK
1.24×10⁻⁴
8-PSK
1.47×10⁻³
16-QAM
Reference Thresholds (BER = 10⁻⁵):
BPSK/QPSK ≈ 10.5 dB | 8-PSK ≈ 14 dB | 16-QAM ≈ 17 dB
Adjust the slider to explore BER values in real-time.
BPSK/QPSK ≈ 10.5 dB | 8-PSK ≈ 14 dB | 16-QAM ≈ 17 dB
Adjust the slider to explore BER values in real-time.
📈 BER vs. Eb/N₀ Curves
📐 Theoretical Formulas
BPSK (2-PSK)
BER = ½ · erfc(√(Eb/N₀))
BER = 10⁻⁵ at ~10.5 dB
QPSK (4-PSK)
BER = ½ · erfc(√(Eb/N₀))
BER = 10⁻⁵ at ~10.5 dB
8-PSK
BER ≈ (2/3) · Q(√(2k·γ·sin²(π/8)))
BER = 10⁻⁵ at ~14 dB
16-QAM
BER = (3/4)(1−1/√M) · erfc(√(3kγ/(M−1)))
BER = 10⁻⁵ at ~17 dB